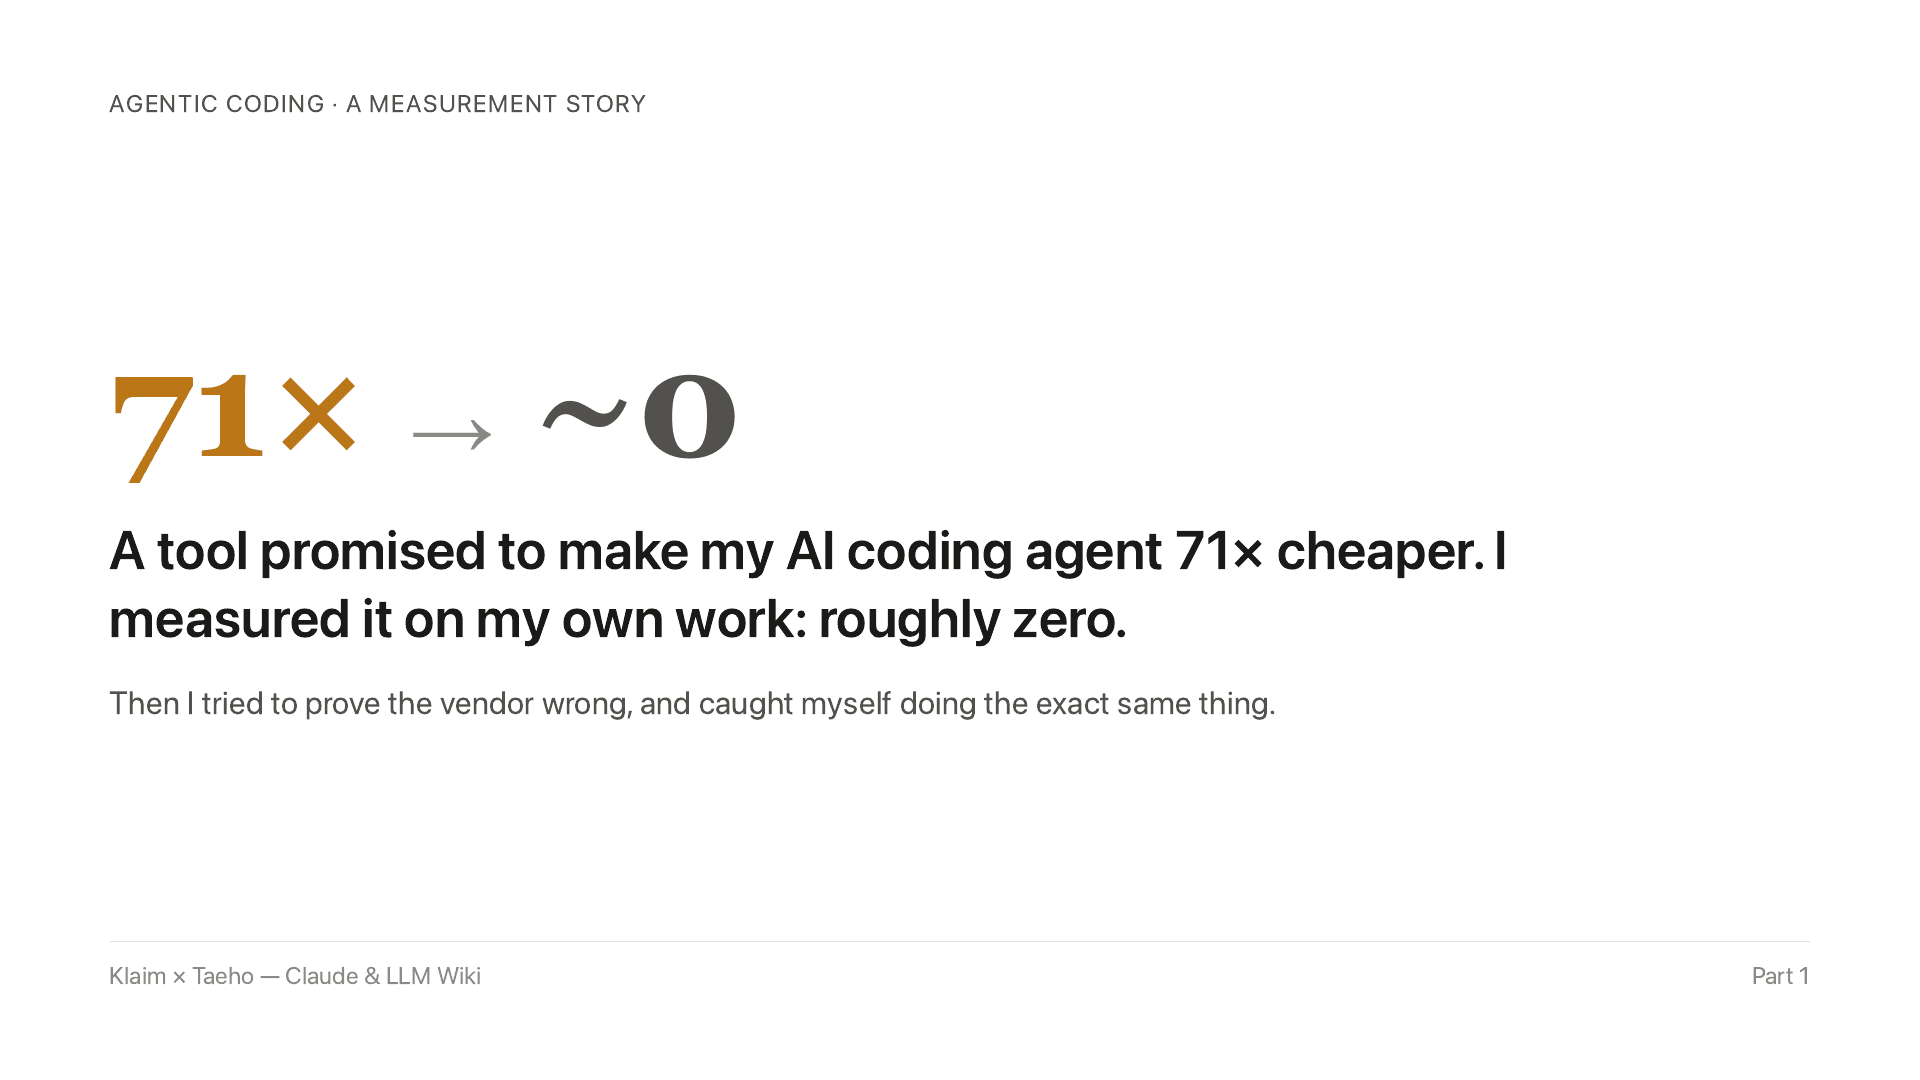
Part 1 of an agentic-coding measurement series. I tried to make my AI coding agent cheaper. A tool promised 71× savings. I measured roughly zero — then caught myself doing the same thing. I run AI agents on real codebases every day, and the expensive part is the searching. The agent reading file after file to find what matters. So when graphify, a tool that turns your codebase into a queryable graph, advertised it could cut that cost by 71×, I was instantly interested. 71 times is the kind of number that makes you install something without reconsidering. But I decided to take the long way around. I measured it on my own real work using an actual Python service of about 124 files instead of trusting the headline. Long story short: the savings were roughly zero. Where does a 71× even come from? Not "smaller than advertised." Zero, inside the normal noise between one run and the next. So I went looking for where a 71× could even come from. I found it: a single benchmark on a giant codebase, measured against a baseline no real person would ever hit. The repository stated its best case using the most wasteful possible way of doing the task instead of a realistic one. To be fair, the 71× is real inside that benchmark — the number isn't a lie. I've done my own research and found two independent reviews landed far below the stated 71×. One measured 7.3× on a real codebase; the other mapped the savings to repo size: graphify's sweet spot is 500–5,000 files. Mine has 124. Which is the first thing I had to be honest about. I tested graphify at the very low end of where it's meant to help. So my "zero" isn't "graphify is fake." It's narrower, and I think more interesting: on a small, real codebase, running autonomous agents, the advertised win didn't show up. Even though one reviewer's own range (6–15× at 100–500 files) says it should have started to. Maybe 124 files is simply too small. Or maybe the savings that help a human don't transfer to an agent. One codebase can't tell you which. Then I audited myself I had my post anyway. "Vendor numbers are inflated. Here's the proof." I started writing it. Then a small, uncomfortable question stopped me: if I'm about to hold their number to the fire, what about mine? So before publishing, I audited my own experiment the way I'd audit a stranger's. I tried to break it. Three passes: one on the method, one that recomputed every number from the raw logs, one on what was even safe to share. Five of my eight conclusions didn't survive. The worst one: my own measurement dashboard had been lying to me for nearly three weeks. On a few runs the agent had quietly hired sub-agents and split the job across several helpers. My counter was only watching the main worker, not the helpers. One run my dashboard logged as 64,000 units of work had actually done 566,000. Nearly 9× off. I'd even written a little note explaining that run as "ended early." It hadn't ended early. It had done the most work of all, in the one place I wasn't looking. Other "findings" turned out to be noise I'd dressed up as signal. A cost increase that vanished the moment I removed one run, a quality drop that was really a bug in my own scoring, not graphify's fault. What survived Here's what did survive, and it's quieter than the post I almost wrote: on this codebase, graphify saved no tokens and no money on any task I gave it. That result got stronger after the audit, not weaker. And this is the part I think is actually worth your time as someone building with agents: graphify is a map, and maps are wonderful for a human exploring unfamiliar ground. But an autonomous agent is a different kind of user. Give a person a map and they explore faster. If an agent gets a map to a codebase, it trusts it — and stops double-checking the territory. On one task, the mapped agent actually got less thorough. The tool that speeds you up can quietly make your agent lazier. (I only half-trust even that result because my own scoring favored the old method. So I'm reporting it as "maybe," not "proven.") That's the whole point, and it cuts both ways: an "Nx" claim is only as honest as the number you divide by, both graphify's and mine. Their 71× and my early conclusions came from the same problem. I just caught mine before I hit publish. What happens next The flawed experiment wasn't just a failure, but was a lesson. Publishing anything without the audit would have been the real failure. So here's the fix I will be doing. I'm re-running the whole thing on public codebases anyone can download. Small, medium, and large, so the size question gets a real answer with the method locked in writing before the first run, and every flaw the audit caught turned into a rule. My prediction is on the record. Part 2 — come check my work. Sources: graphify on GitHub · roborhythms' review of the 71× claim · Exchangepedia's honest benchmark (7.3×). My raw data and audit method ship with Part 2, on a public codebase. Originally published on LinkedIn: https://www.linkedin.com/pulse/71-measured-zero-how-i-audited-my-own-ai-experiment-lk26c/ · Part 2 (public codebases, pre-registered method) is in progress; the protocol, harness, and data will be public.